Help Toolbar (select a button to browse other online help sections) Home Tutorials Resources Search Tabs & Menus Button Bar Table & Data Display |
Creating a Custom Report (using Customized Views)
The Customized View feature allows you to arrange and present your payroll data in any manner that you need. Custom reports can provide a means of detailed analysis from any aspect. For this tutorial, we will use the Customized Views feature to modify our report column display, to sort our data, and to export it for further editing outside of eNETEmployer.
About Customized Views - Customized Views is a powerful feature that allows you to organize and save a user-defined set of columns and viewing preferences for any program screen. Once these custom preferences have been saved, they are known collectively as a "View". Customizing the column view allows you to work with your data in a manner that best suites your working style. You can also use views to create custom reports that meet your specific reporting needs. Refer to the Customized Views help topic to learn more about this feature. |
This tutorial includes the following sections:
- Part 1: Customizing the Column View
- Part 2: Sorting Column Data
- Part 3: Printing a Custom Report
- Part 4: Exporting a Custom Report
NOTE: Click on an image below to view it at full size.
Part 1: Customizing the Column View:
Note: The following instructions apply to ALL program screens: The following section of this tutorial discusses how to customize the view for the Employee Address screen - but you can use these instructions for any and all eNETEmployer screens. |
This first tutorial will show you how to create a customized report that shows basic employee contact information. We will begin by customizing the column of data found on the Current Payroll - Employee Address screen.
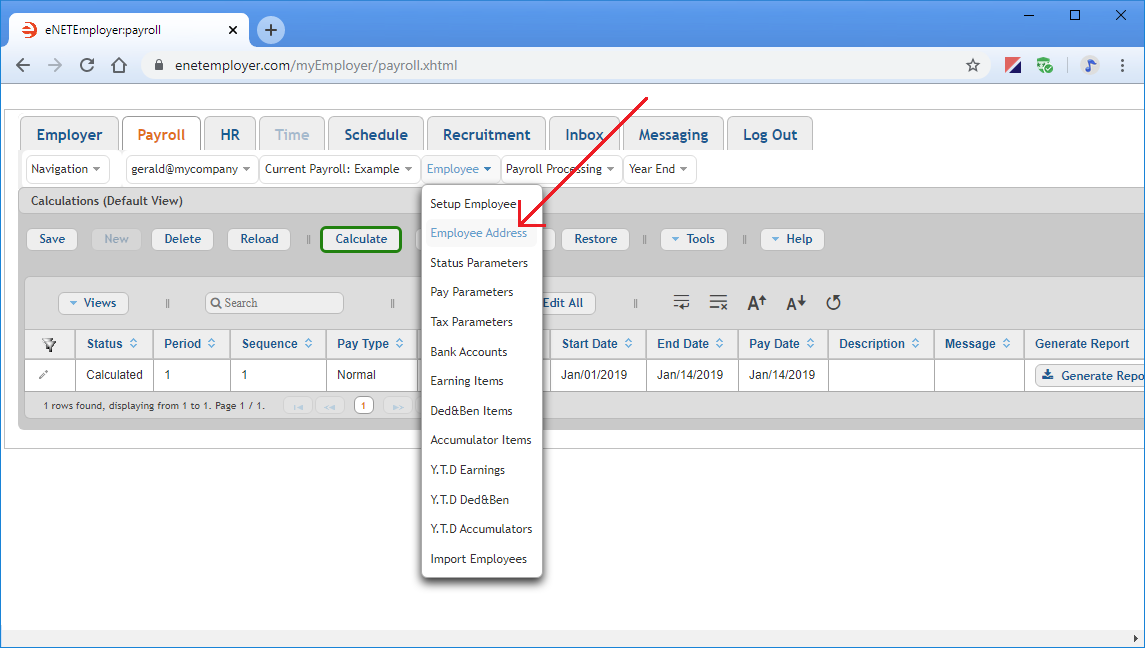
- Open the Payroll module and then select the Employee menu to view the available options.
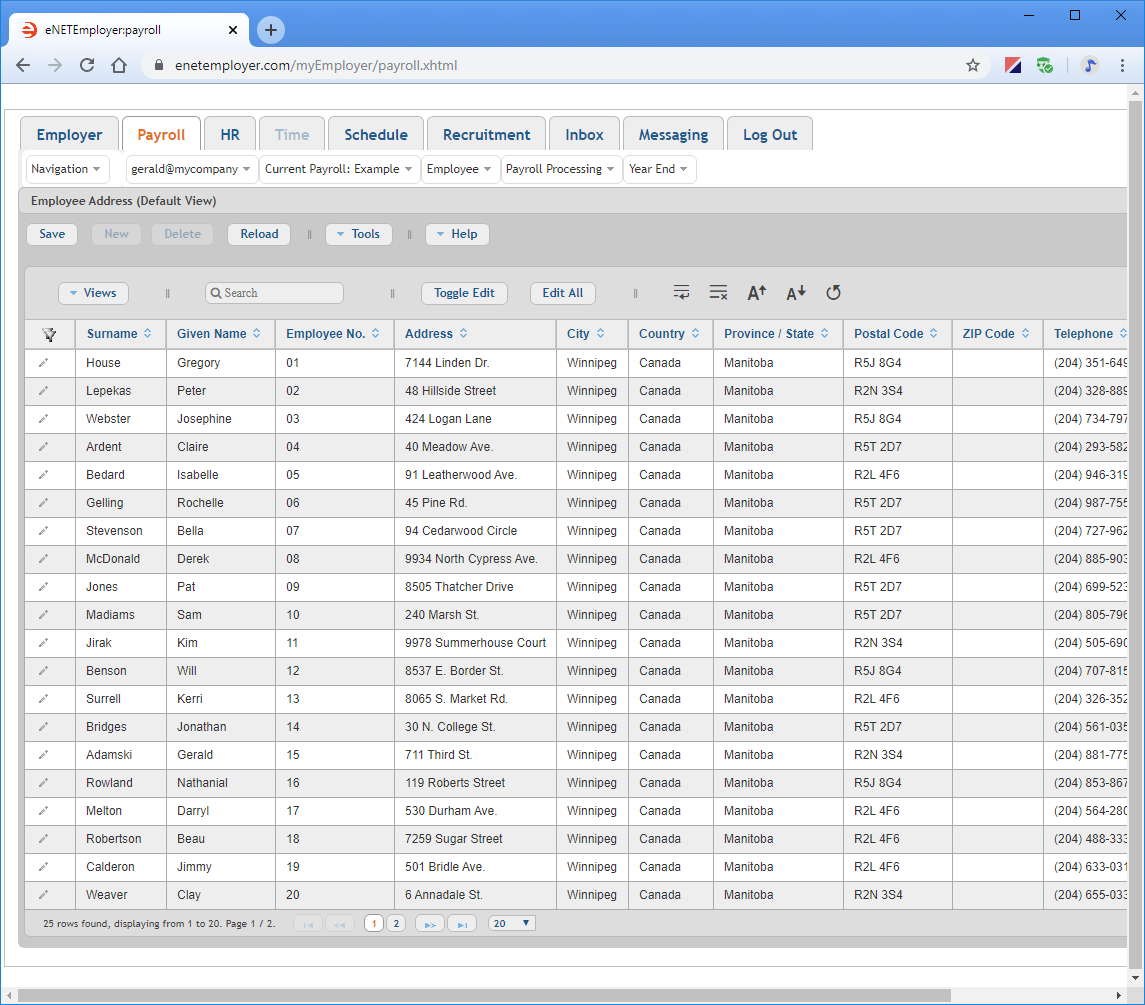
- Select the Employee Address option. This opens the Employee - Employee Address screen where you can view and define the address settings for each employee in the payroll.
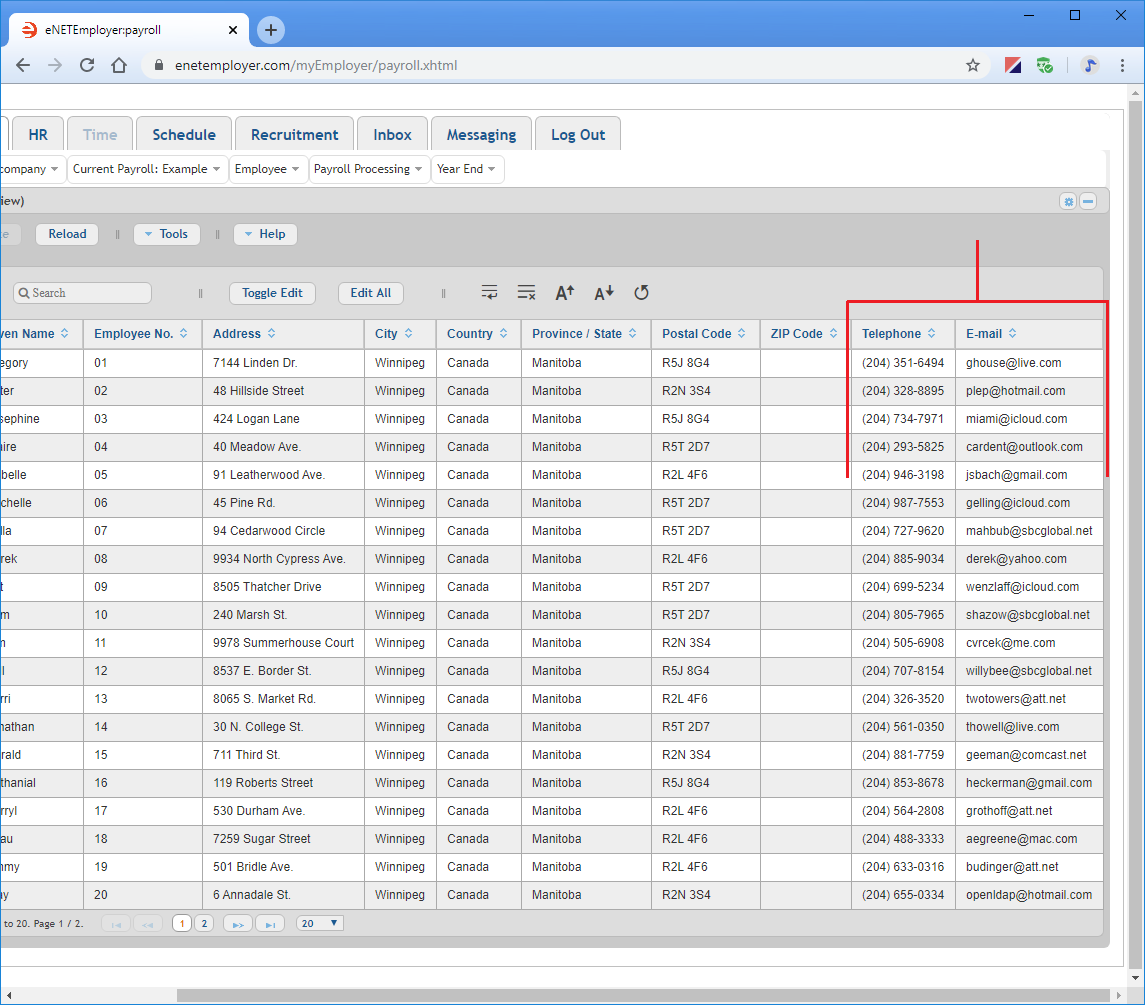
- Depending on the width of your browser window, you may need to scroll to the right of the table to see the various columns that are included in this "default" view. In the example below, we see that the employee Telephone and Email columns appear as the last two columns in the table.
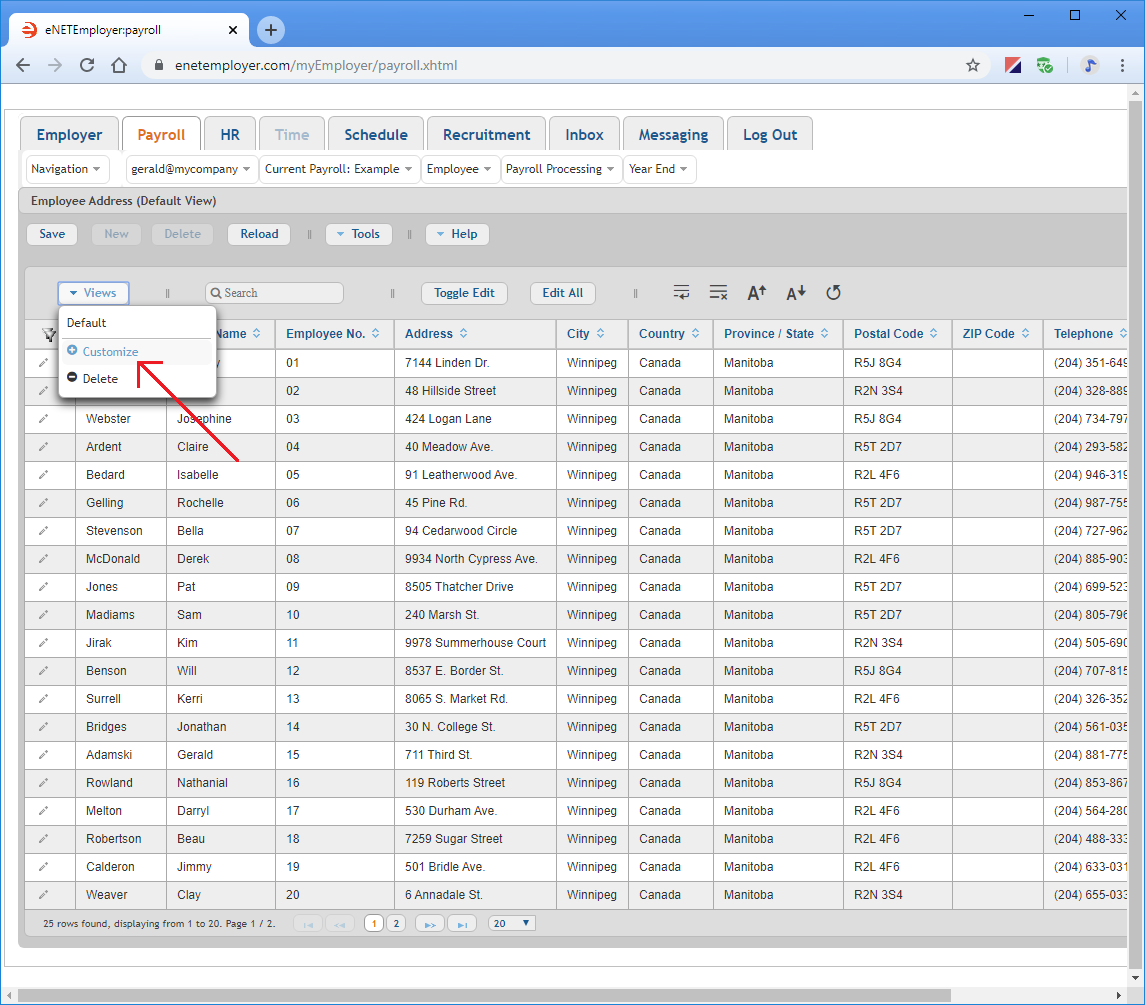
While the default view provides a useful set of data, we wish to create a customized report that includes only the employee names, numbers, telephone and email information. We will do this by utilizing the Customize View feature to remove several columns. - Select the Views button that is located at the top left of the table. This displays a drop-down menu with options that control the columns that you see in the table.
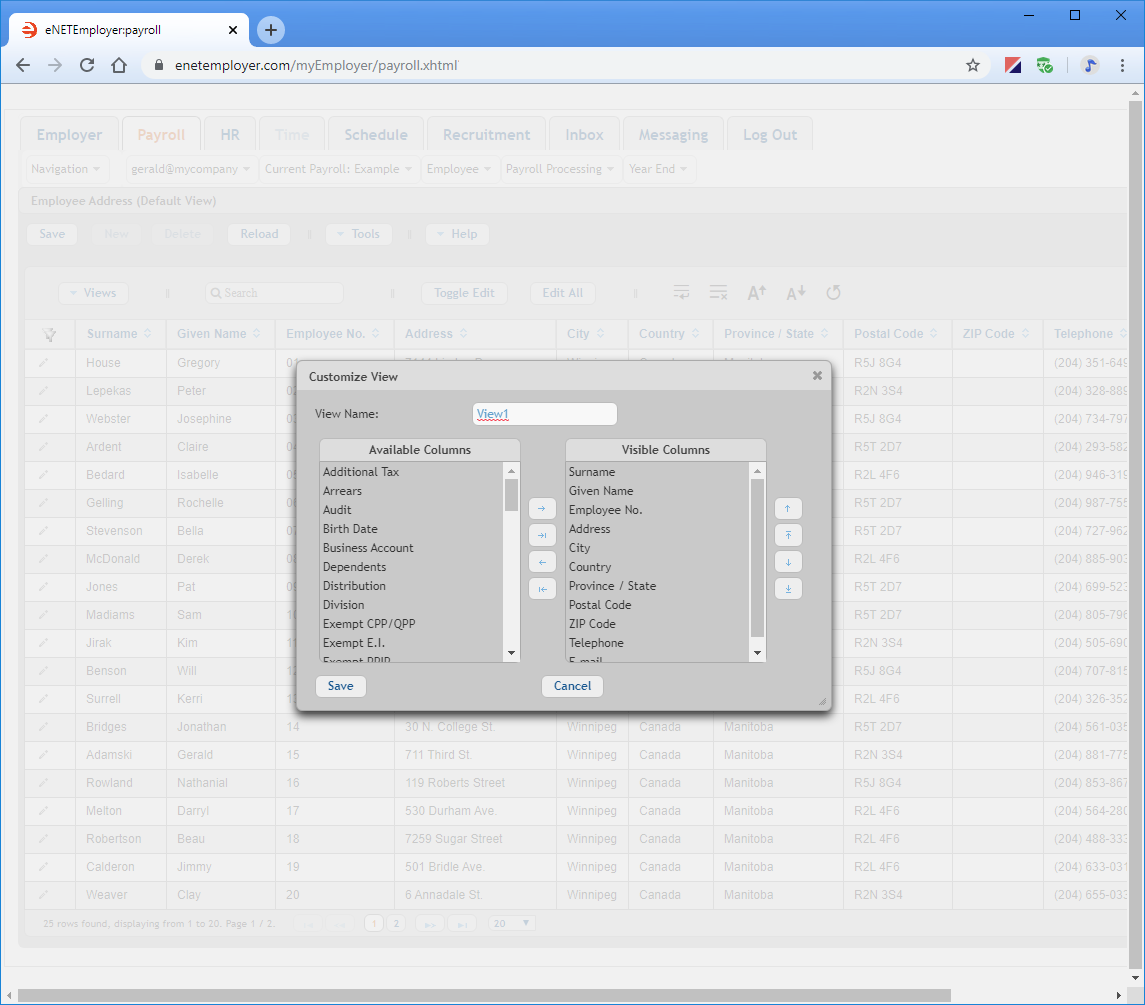
- Choose the Customize option from the drop-down menu. This displays the Customize View window.
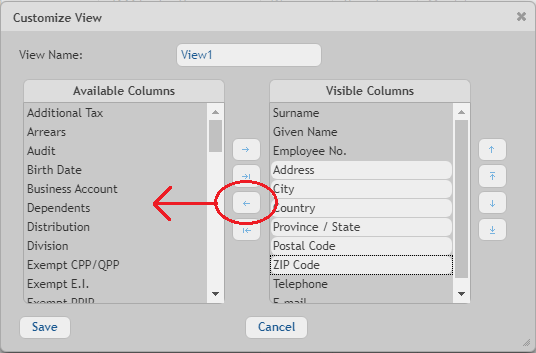
The Visible Columns section on the right side of the window shows the set of data columns that are currently visible on the screen. The Available Columns section on the left shows many other data columns that you can choose to display in your table simply by moving its corresponding label over to the right section of the window. Columns can be moved in a number of ways: - Starting with the Address label, hold down the <Ctrl> key on your keyboard as you click on each subsequent label that you wish to remove. In our example, we will select Address, City, Country, Province/State, Postal Code and Zip Code.
- Once the items are selected, move them to the Available Columns section by dragging them to the left or by choosing the left-facing arrow icon. Note: If you mistakenly move columns and cannot recall the previous order, you can undo the move by choosing the Cancel button to close the Customize View window, and then re-opening the window once again.
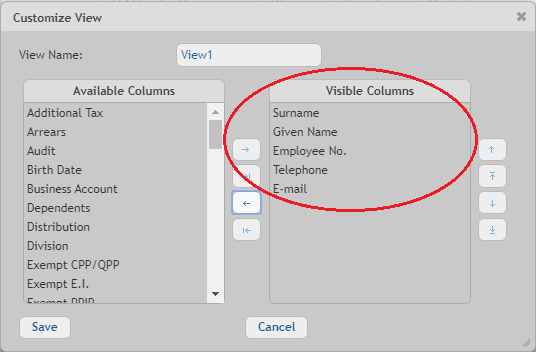
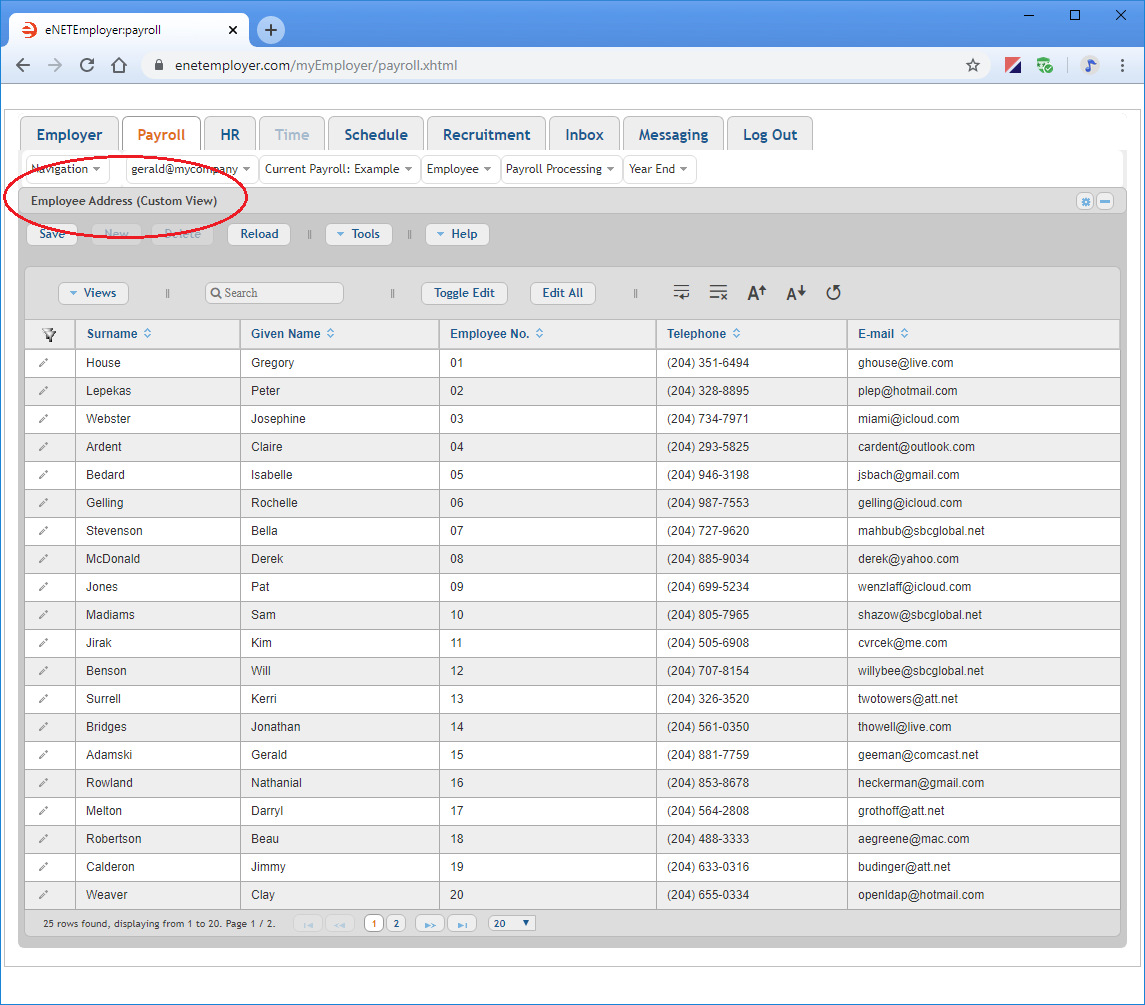
In our example below, we have removed the unwanted columns and are left with 5 columns to display.
- Repeat this procedure to hide additional columns as needed.
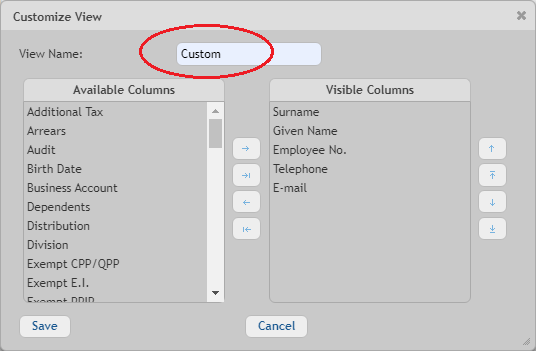
When you have finished removing your unwanted columns, you must assign a name to your new column layout (or "View"). This name will be added to the drop-down list under the Views button, and will be available along with the original Default view. - To add a name for the new column layout, move to the View Name field at the top of the window and replace the suggested default name (View1) with something that better describes the new view. In our example, we will enter "Custom".
- Once the name is complete, choose the Save button at the bottom of the window to store your custom view. You will notice that the table now excludes the columns that you have hidden, and the title at the top of the table is changed to the custom name that you entered.
We will now make one more customization that will help us review the data more clearly when we create our report.
The default set of columns begin with Surname and Given Name, and are followed by a number of other address-related items.
a) Clicking on a column name and dragging it to the opposing section or into a new location in the same section.
b) Double-clicking on a column name (which will move it to the opposing section).
c) Using the arrow icons located in the center of the window to move selected items from one section to the other.
For this tutorial, we will remove (hide) a series of columns so that our report will only include the data we wish to see.
Part 2: Sorting Column Data:
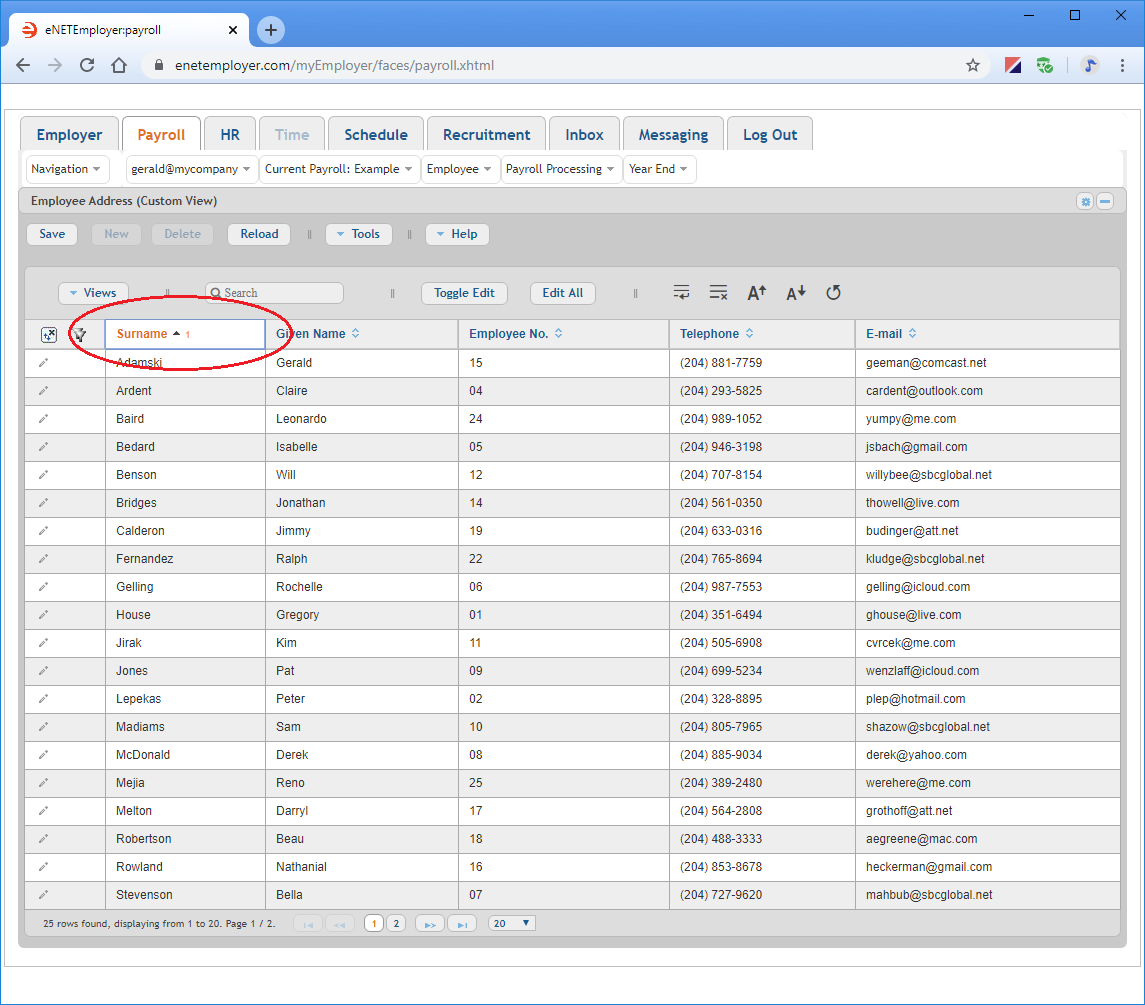
- With the Employee - Employee Address screen open for viewing, move to the Surname column and then select the Primary Sort icon (the two opposing arrows shown at the top of the column). This action sorts the column's data in alphabetical order from top to bottom.
Note: Selecting the text label located at the top of the column performs this same function.
Once the column is sorted, you will notice that the First Level Sort icon (the number 1) appears beside the column's label. This icon appears for the first column that is sorted and signifies that this column is now designated as the primary column for any subsequent sort operation (should you decide to add another column for further sorting). If desired, you can click on the icon or column name once again to reverse the sort order. Note: To learn more about column sorting, refer to the Sort Icons help topic.
With our data arranged and sorted, we can proceed to the next section and learn how to print our report.
Part 3: Printing the Custom Report:
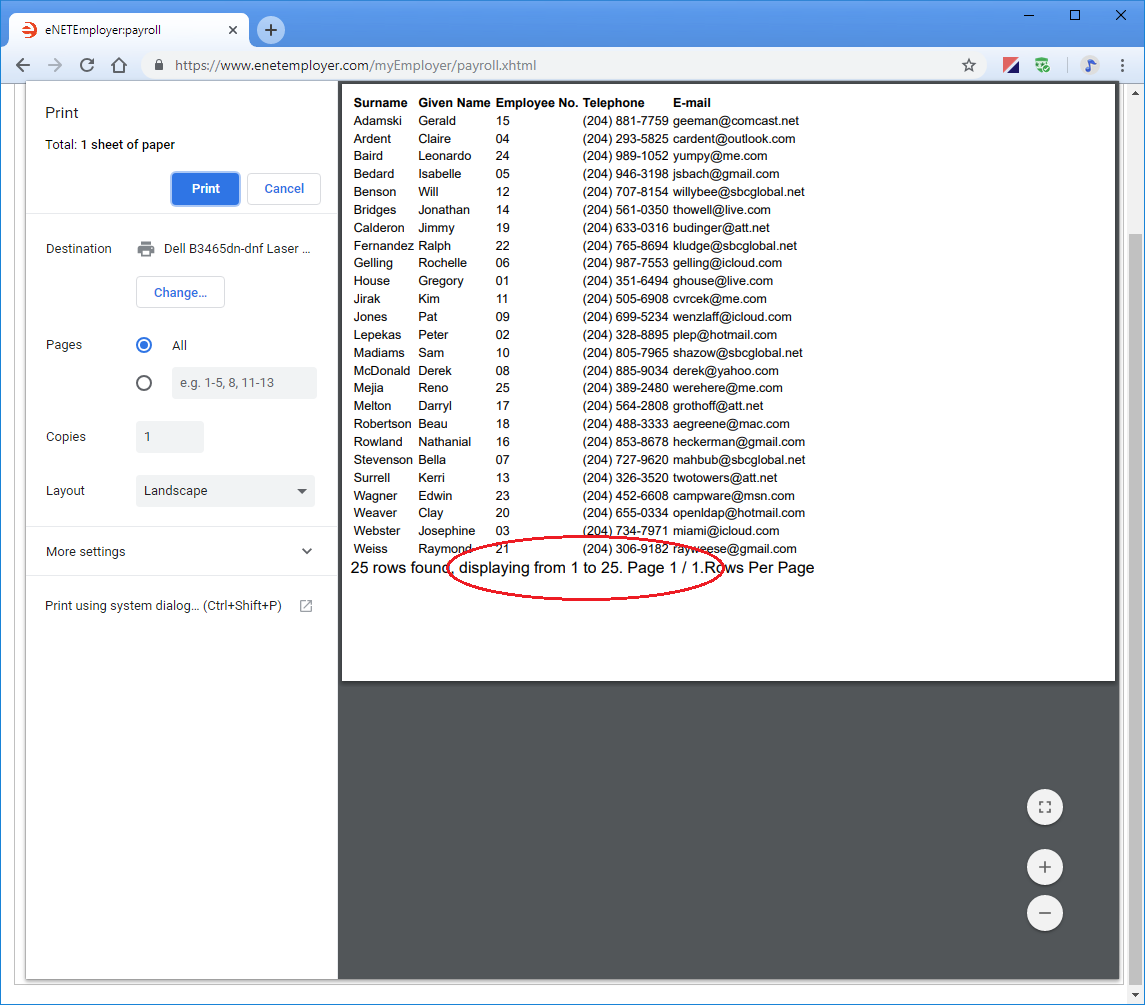
- Choose the Print button from the button bar. This opens the Print window so that you can preview the report before you send it to the printer.
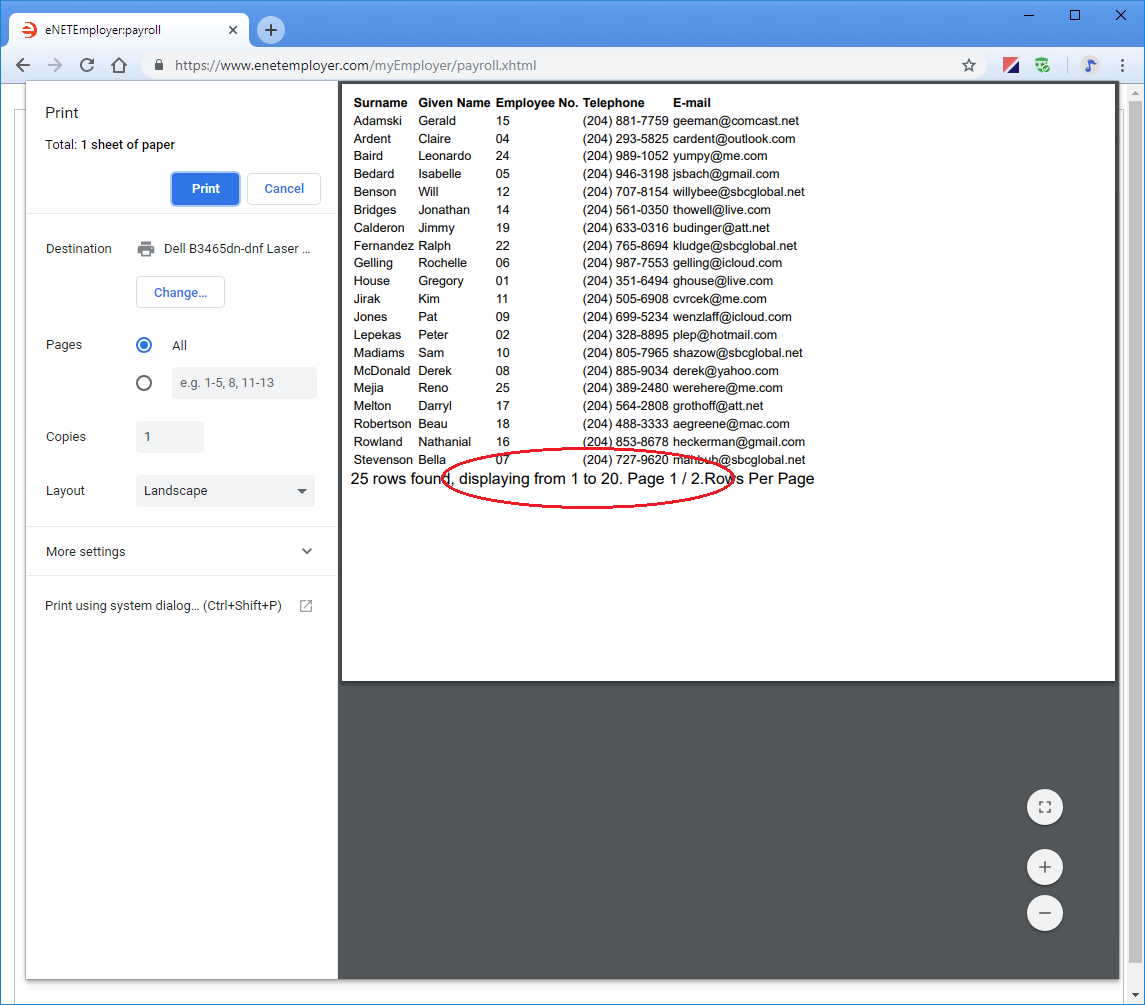 Fig. 11: The Print window allows you to preview the report content before you send it to the printer.
If you have more than 20 employees in your payroll, you will see that only the first 20 are included in the report. This is indicated in our example above where the bottom line of the report shows: "25 rows found, displaying from 1 to 20".
To include all of the employees in our report, we must adjust our display settings as follows:
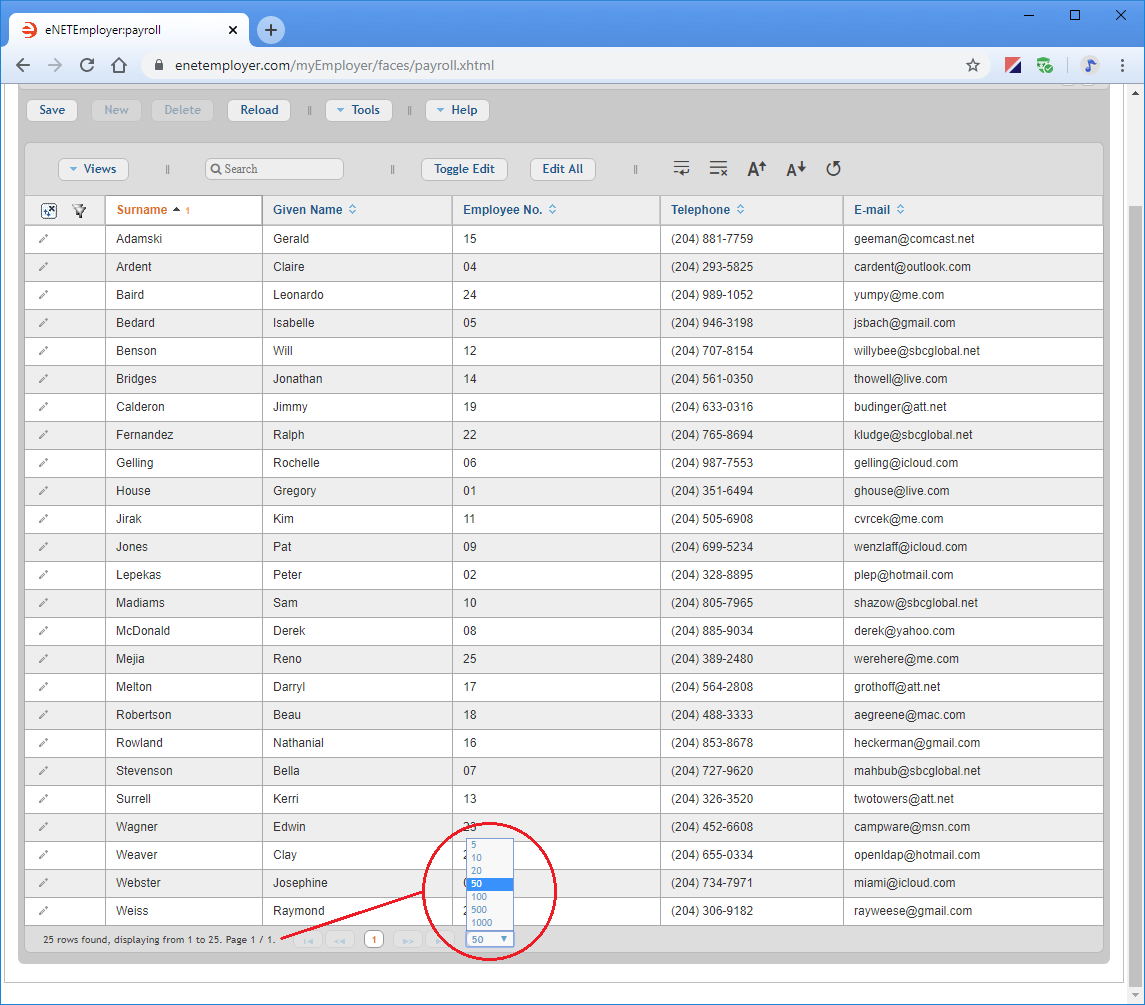
- Select the Cancel button to close the Print window, and then move to the bottom of the eNETEmployer screen to view the Row Display controls. These controls are used to modify the table row display, and are particularly useful when you are working with tables that contain many rows.
- Click the button with the downward arrow to display a set of numbers that correspond to how many rows that you can display on the screen at any given time.
- Choose a number that corresponds to the amount of employees in your payroll. In our example below, we have chosen to display up to 50 rows - that's more than enough to include all 25 of the employees in our sample payroll.
- Choose the Print button from the Button Bar once again to preview the revised report. In our example below, the Row Display indicator now shows: "25 rows found, displaying from 1 to 25". All of our employees are now included in the report.
- Choose the Print button to send the report data to your printer device. This closes the Print window and returns you to the Employee Address screen.
If you wish to add formatting to your text for a more customized look, you can do so easily by exporting the data to a spreadsheet file. Let's proceed to the final section to learn how to export our data.
Part 4: Exporting the Custom Report:
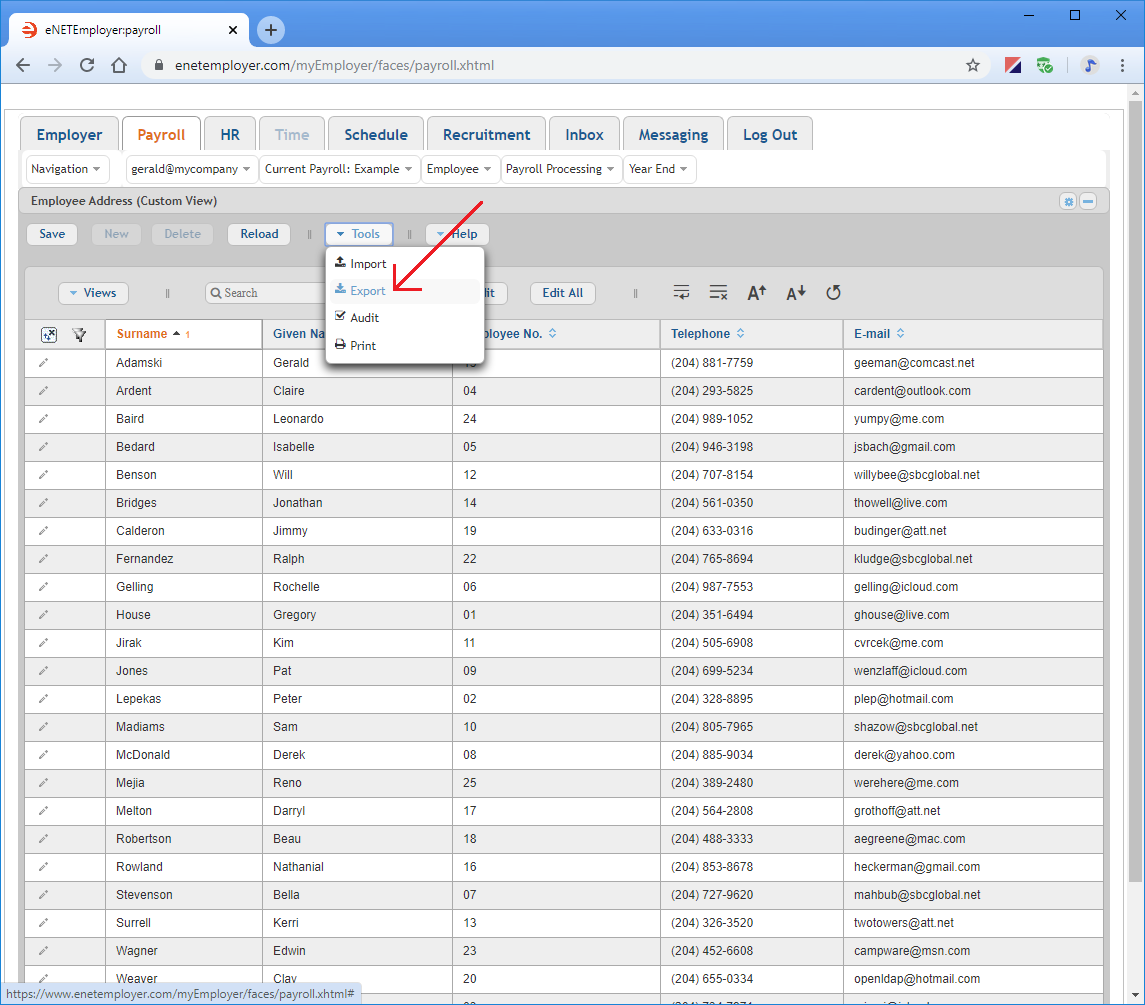
- Select the Tools button from the button bar at the top of the table. This displays a drop-down menu with special data functions that are available for the current screen.
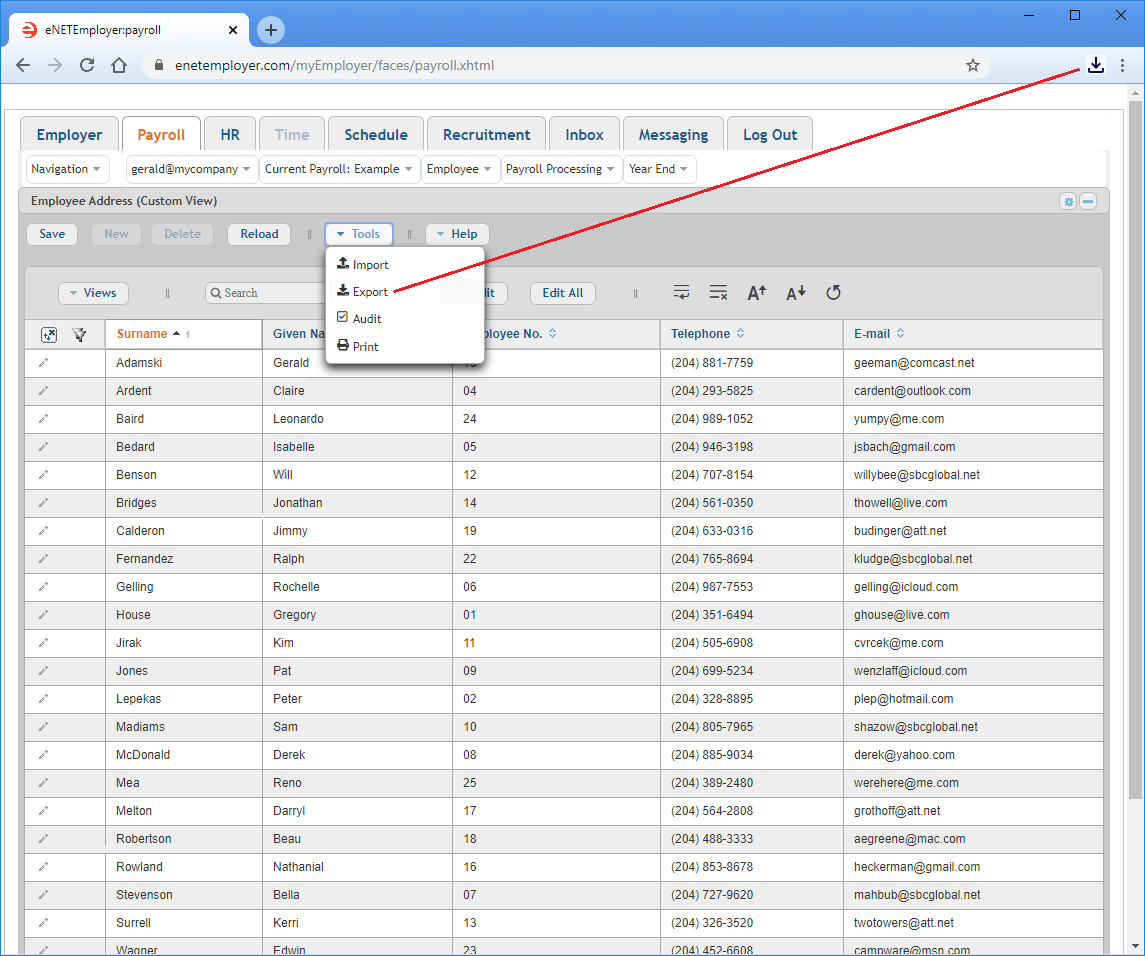
- Choose the Export option from the drop-down menu. This action exports the current table's data as a comma-separated values (.CSV) file. Depending on your browser settings, the resulting document will either be stored in your Downloads folder or you may be presented with a window that will prompt you where to save the file. In most browsers, the document can be viewed via a link that appears at the top-right of your browser.
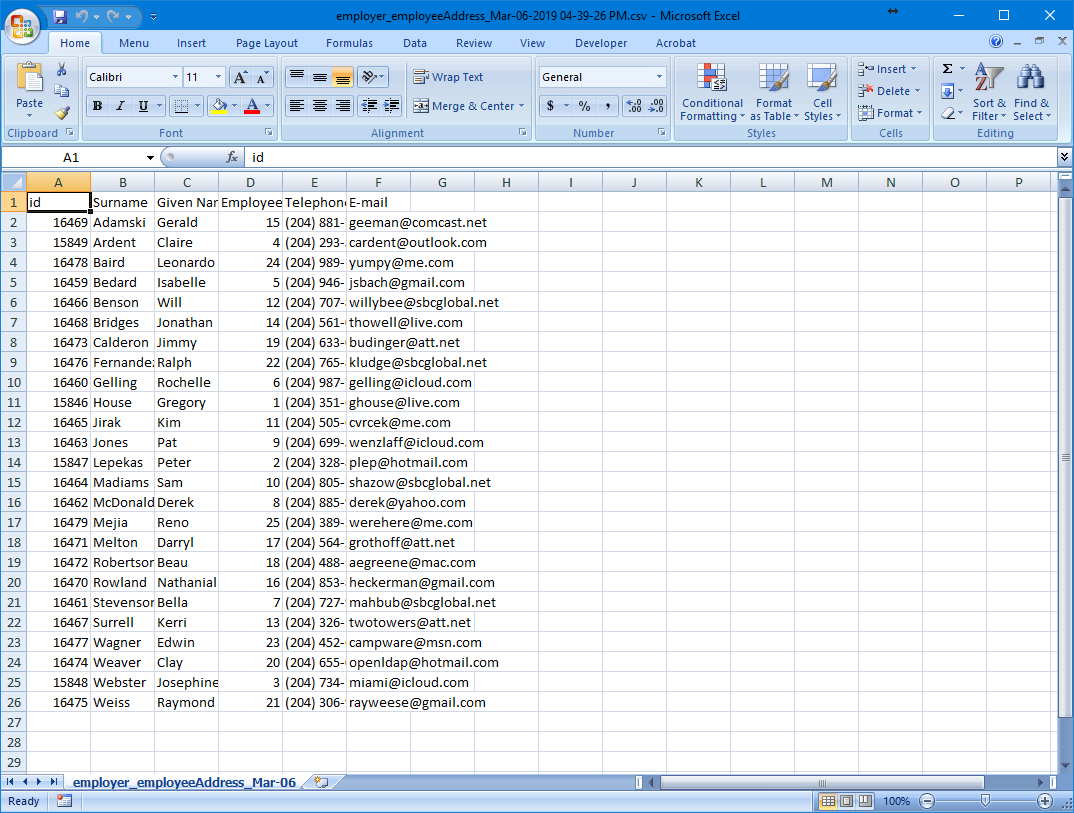
- Click the Download link to access the file, or navigate to your Downloads folder and open the .CSV file using your preferred spreadsheet program. When the file opens in your spreadsheet program, you will see each column of data along with a special ID column that is used for importing purposes. Note: For more information on the ID column, refer to the Importing Data from a Spreadsheet tutorial.
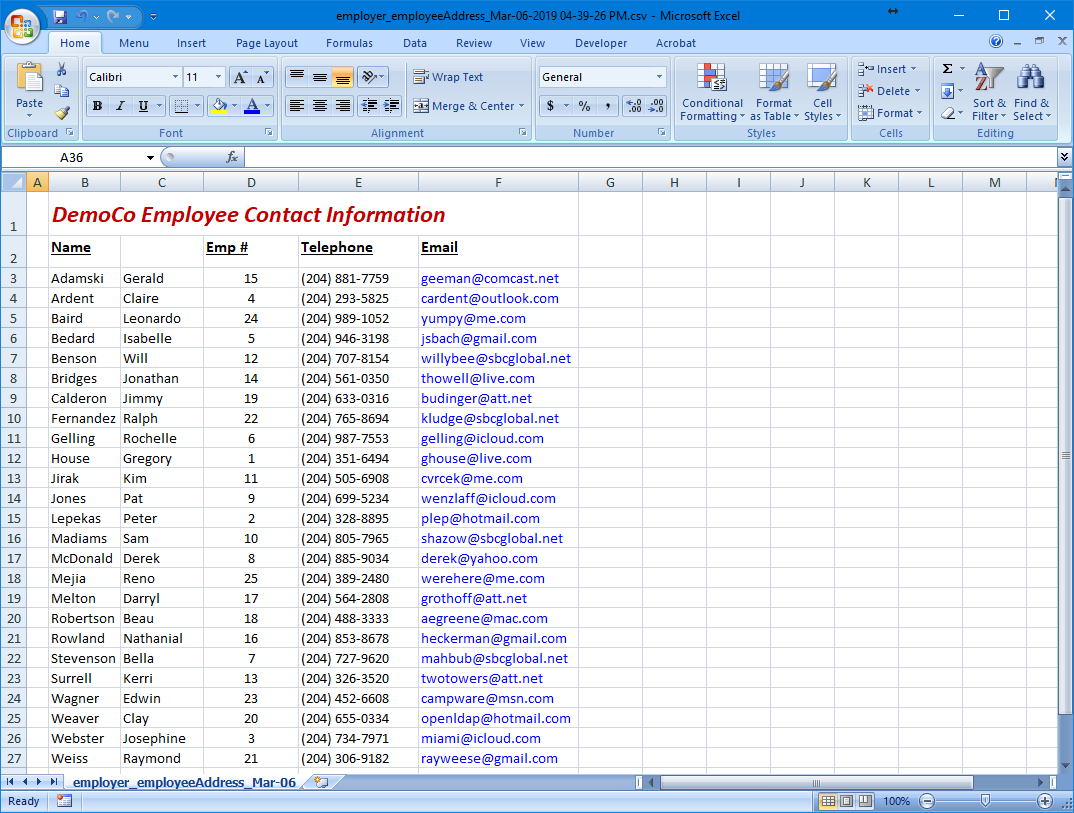
- Edit the data as needed to produce a report that suits your needs. In our example below, we have removed the ID column, added a title, and applied color to various items.
- When you have finished working with your exported report, you can print or save it for future use as needed.
This completes the tutorial on using Customized Views. To learn even more about this feature, please refer to the Customize Views help topic. You can also view the Customized Views and Reports video tutorial that walks you through the feature in detail.
See Also
- Reports Overview
- Payroll Reports
